

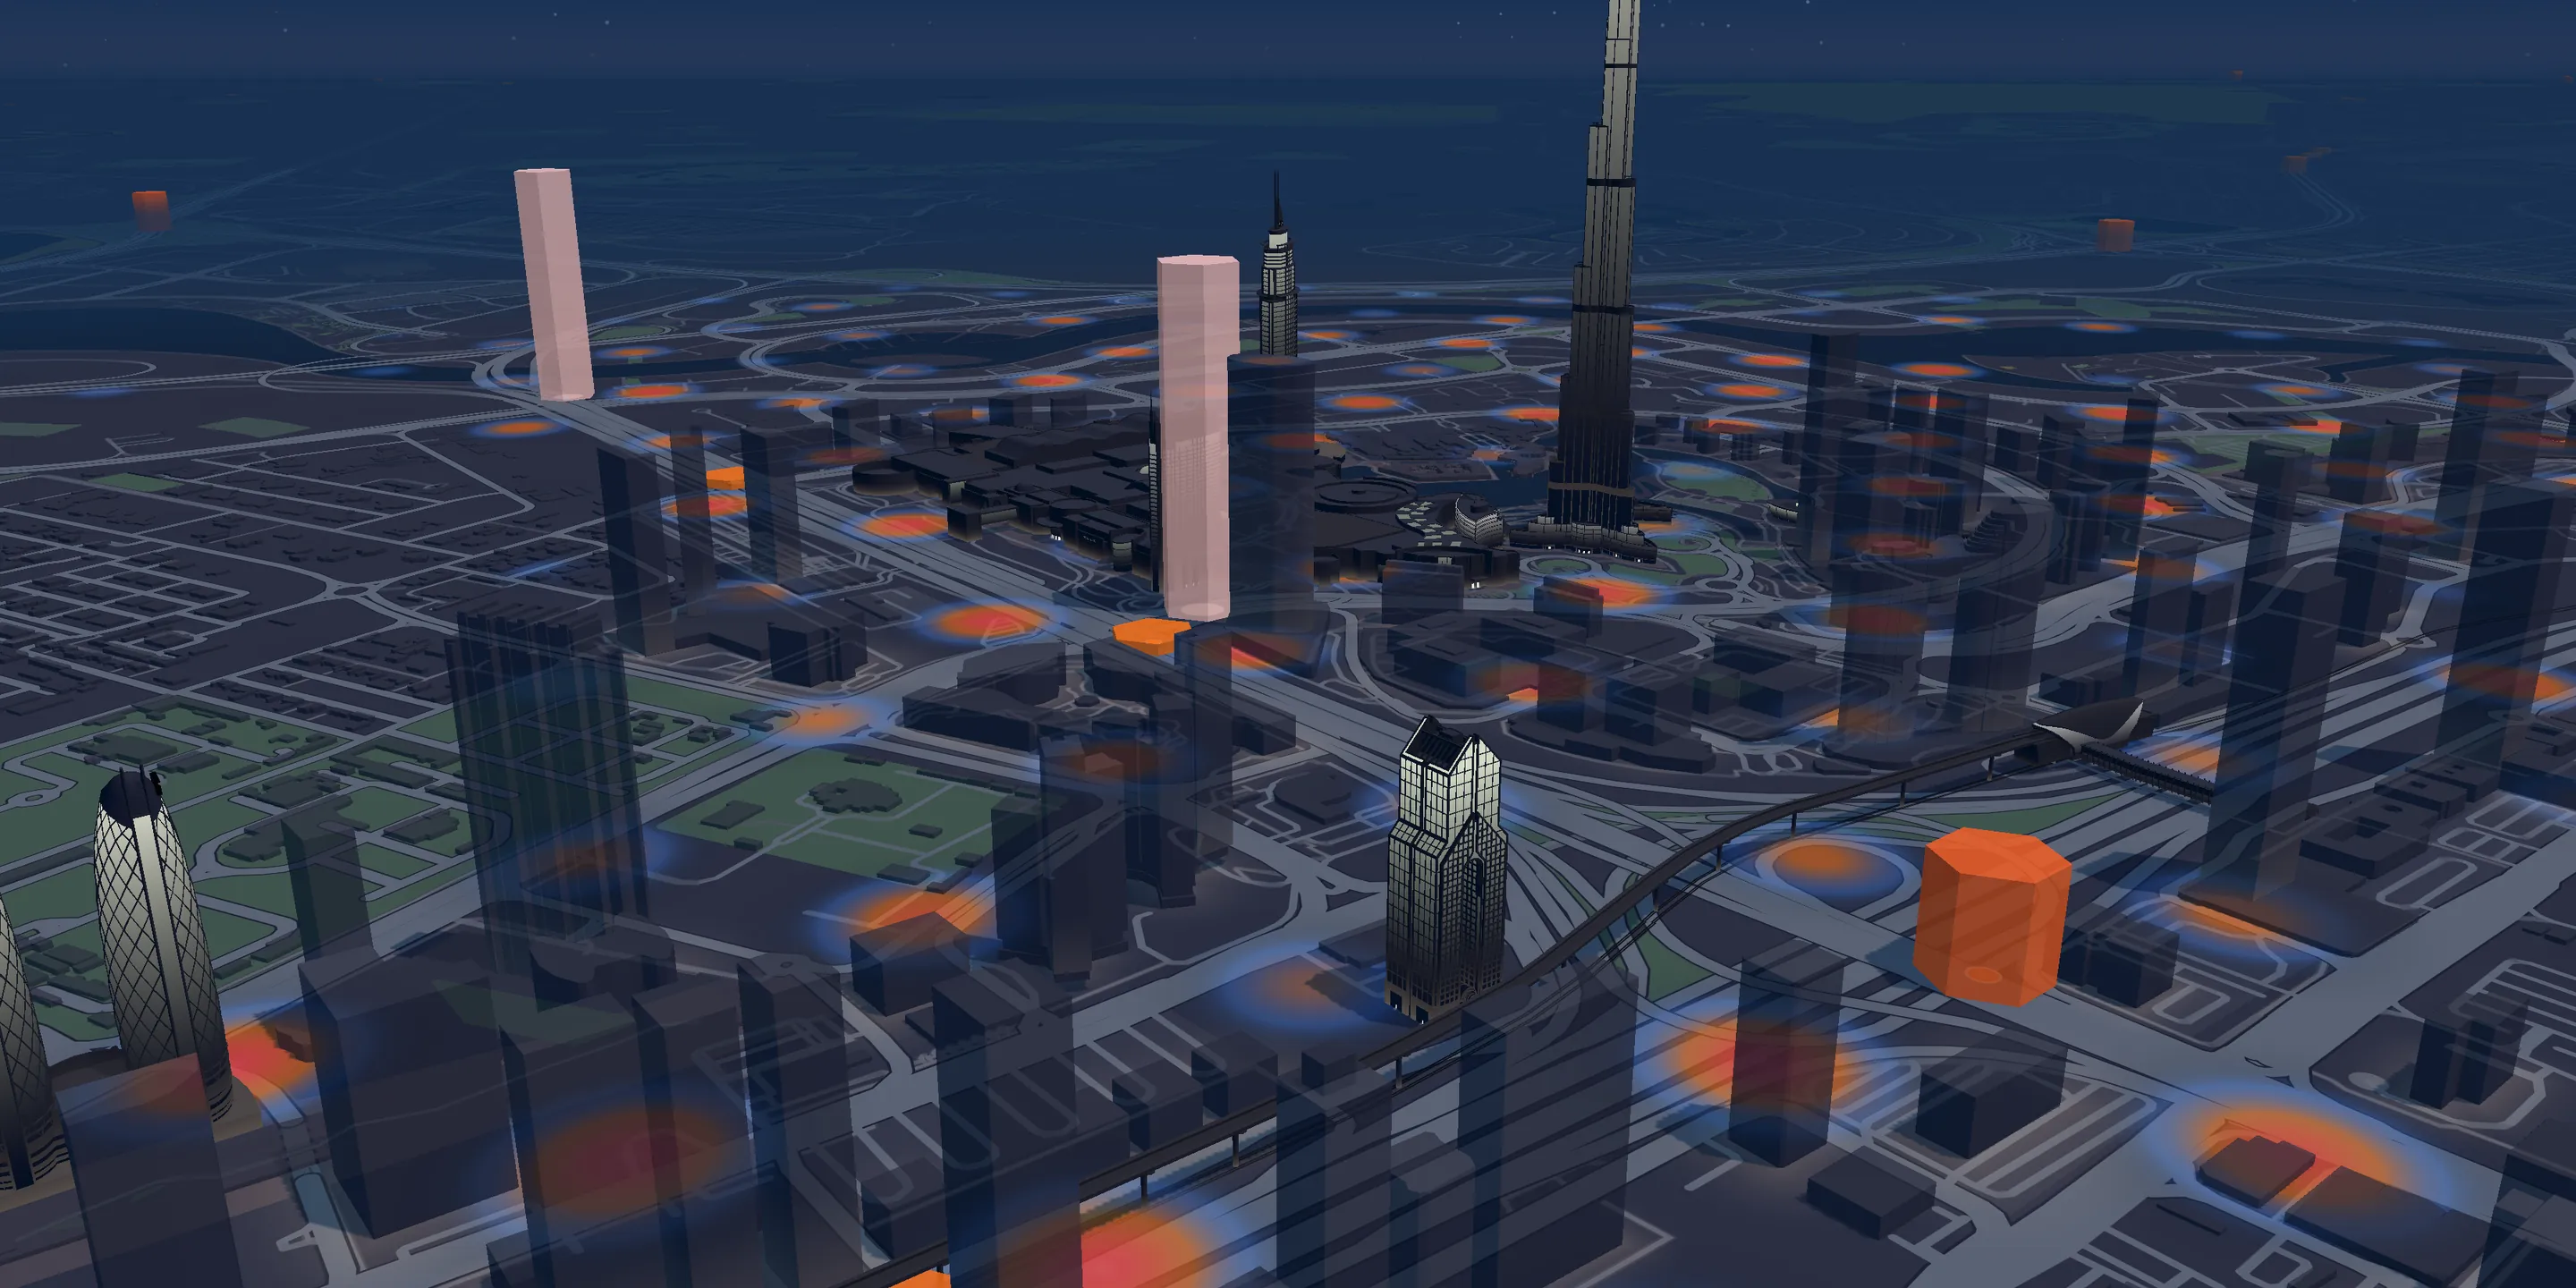
Road risk map · UAE
Where the UAE crashes.
Eight years of police reports, mapped in 3D and turned into warnings that reach drivers before the stretch that goes wrong.
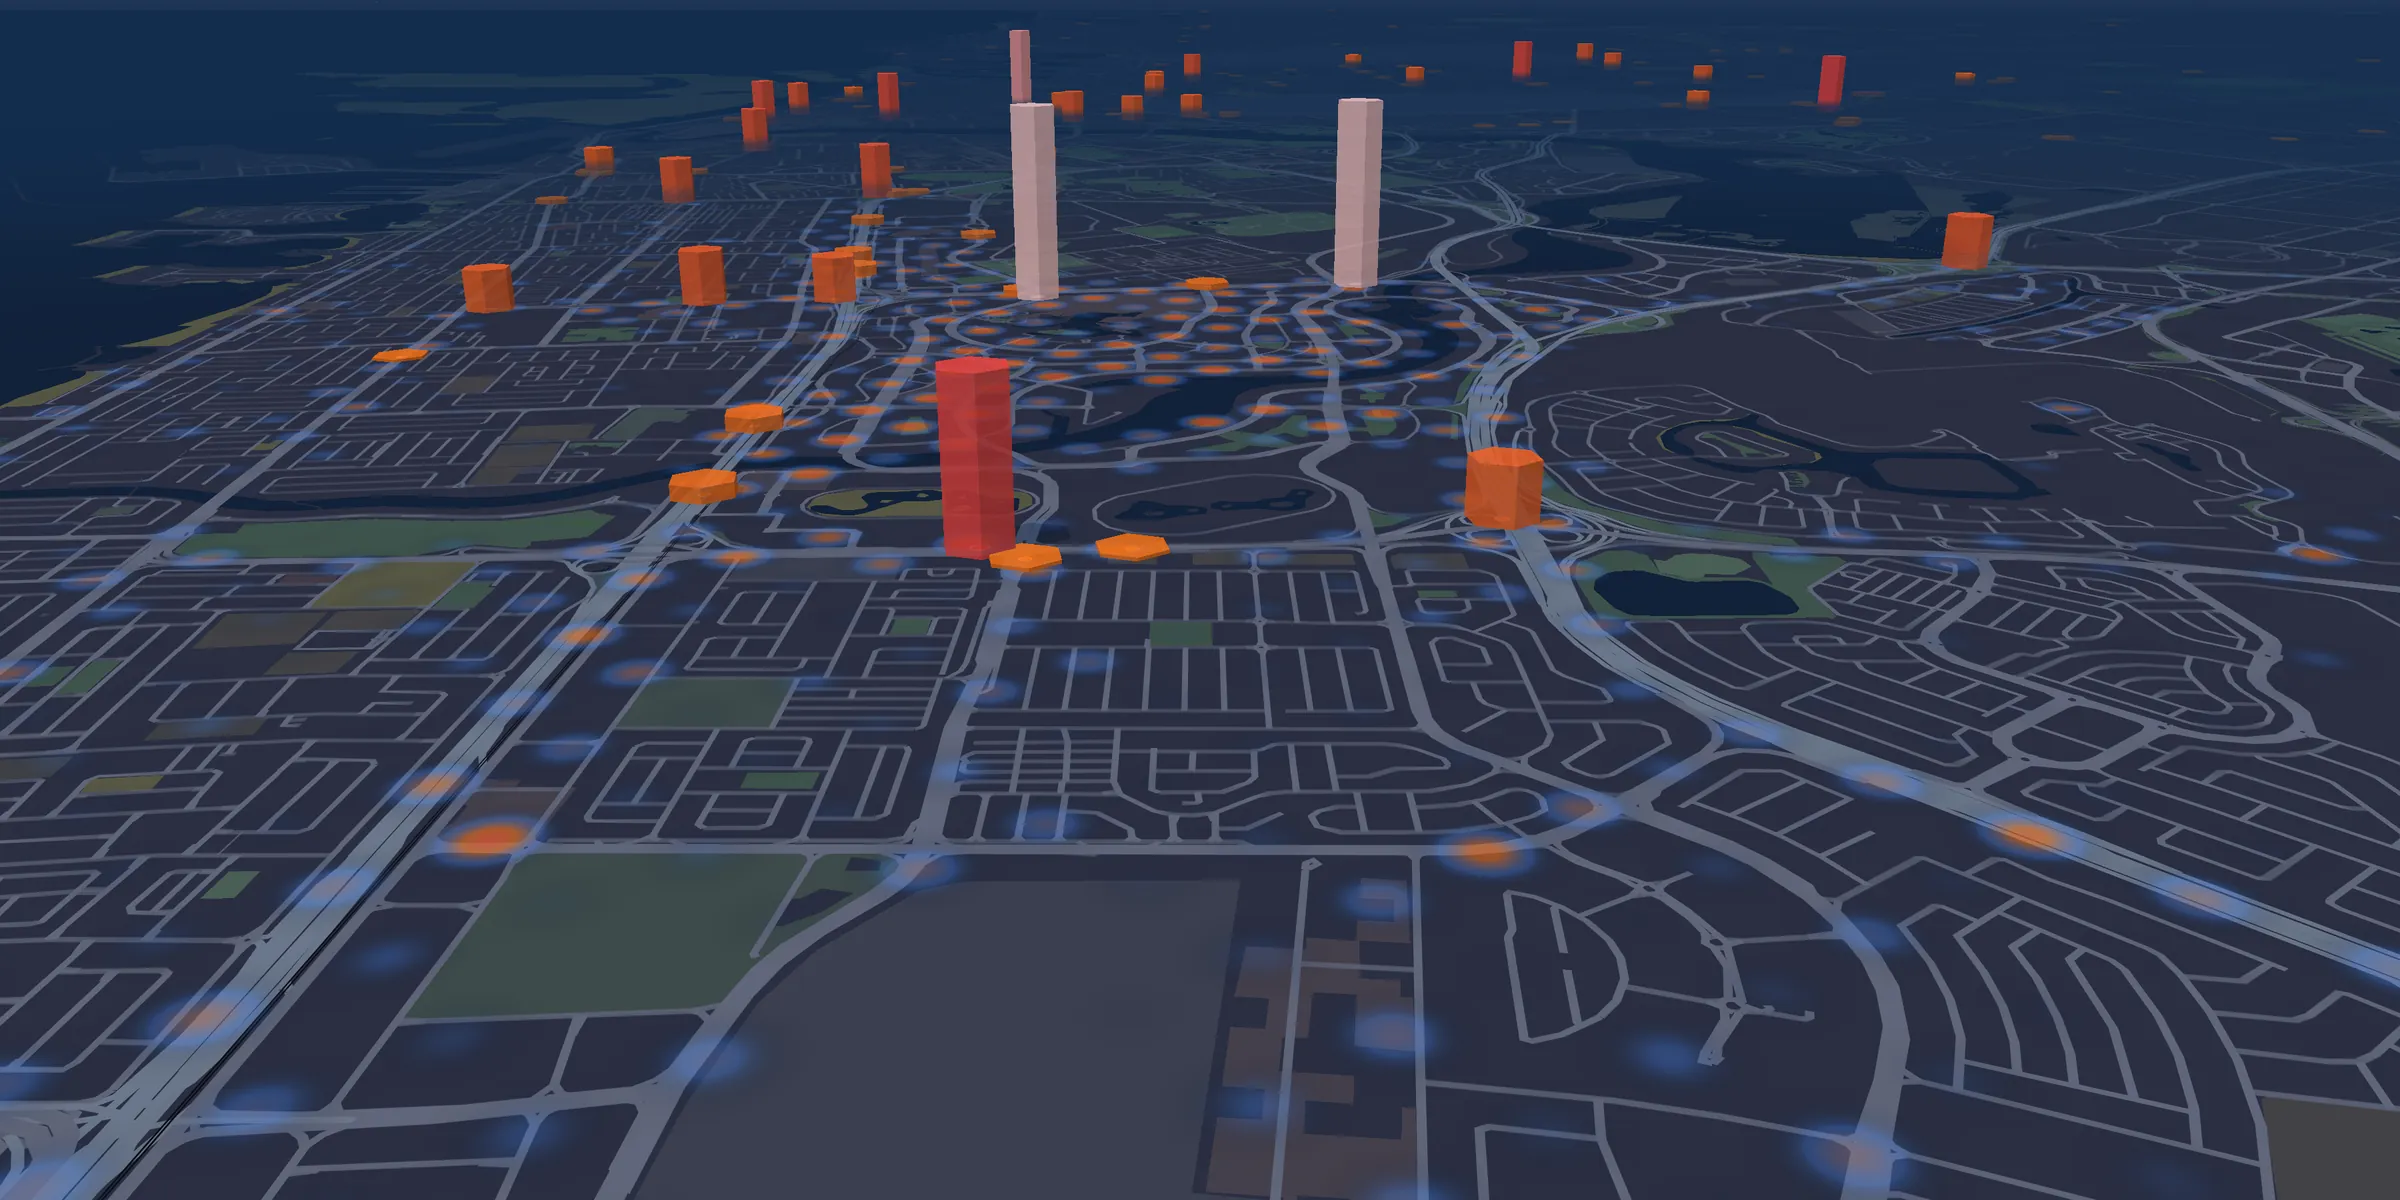
- Crash heat: 155,637 police crash reports, last 3 years
- Pillars: accident-prone zones the app warns about
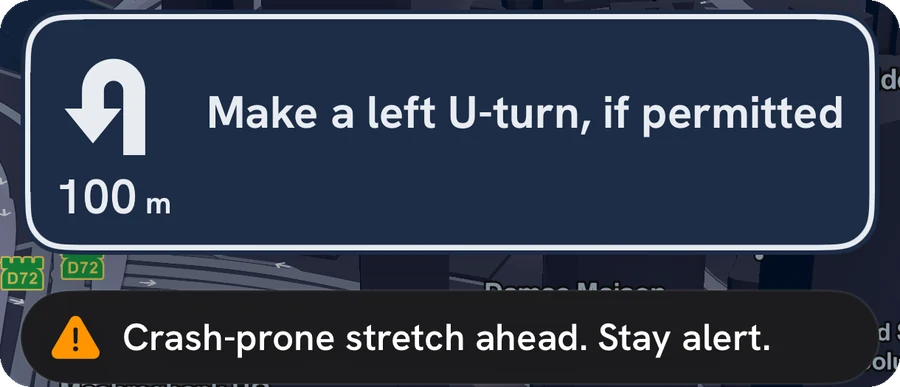
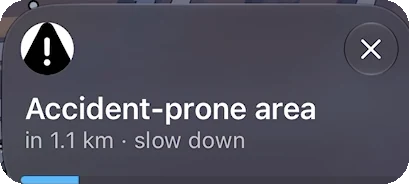
Dubai crash risk on a live 3D map
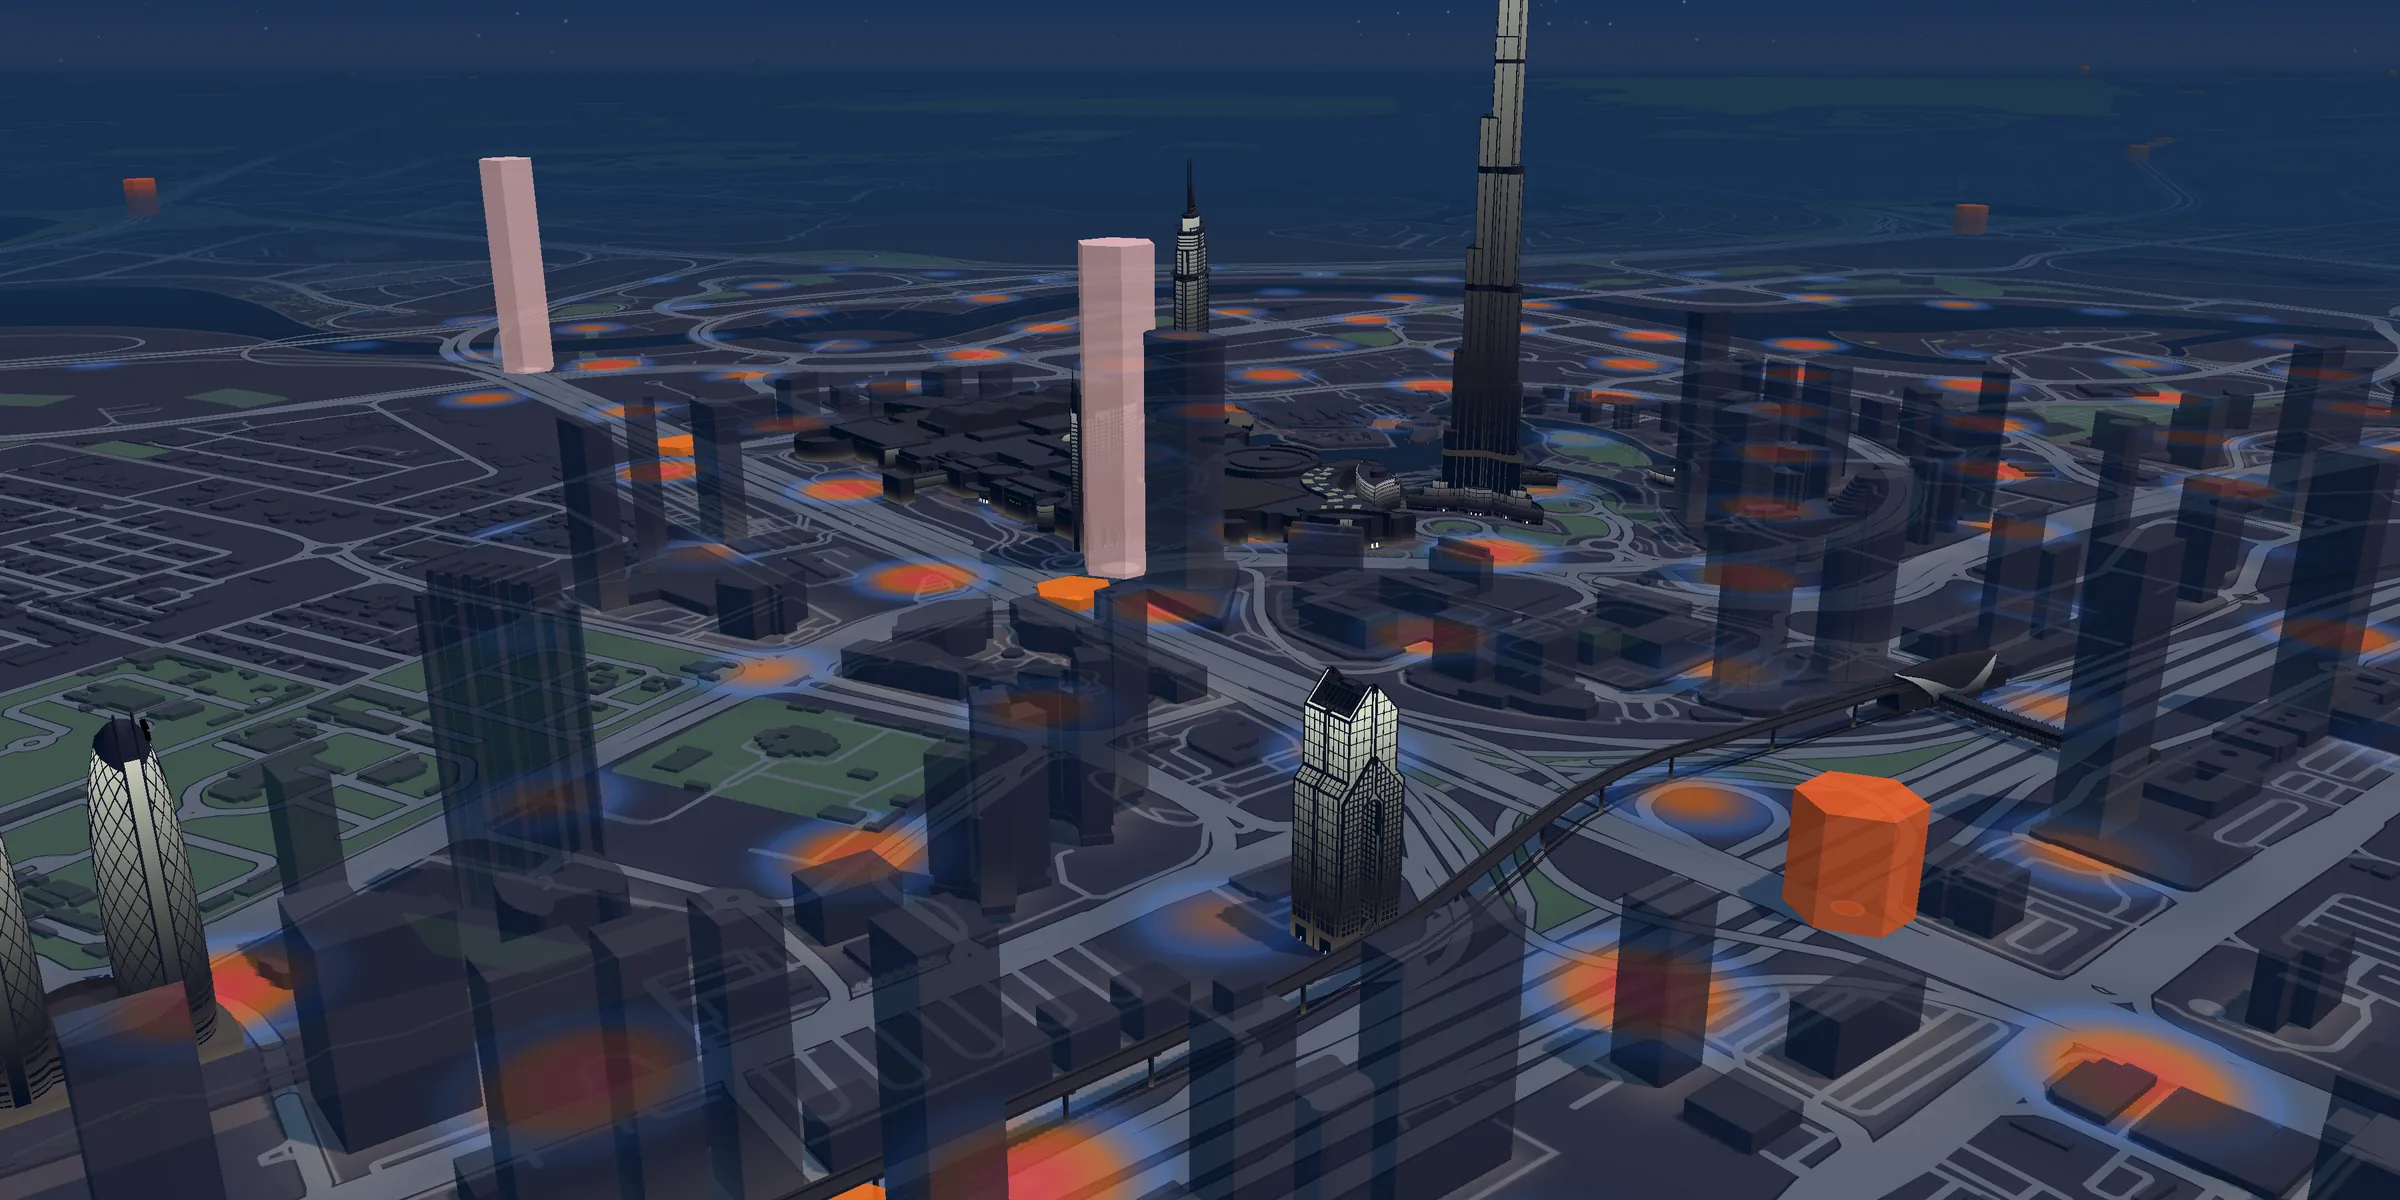
01 · Ground truth
Every crash Dubai reported, on one map.
Eight years of Dubai Police reports, cleaned and placed on the road they happened on. The brighter the street, the more often it goes wrong.
751,323police reports analysed
02 · Signal, not noise
Where it keeps happening.
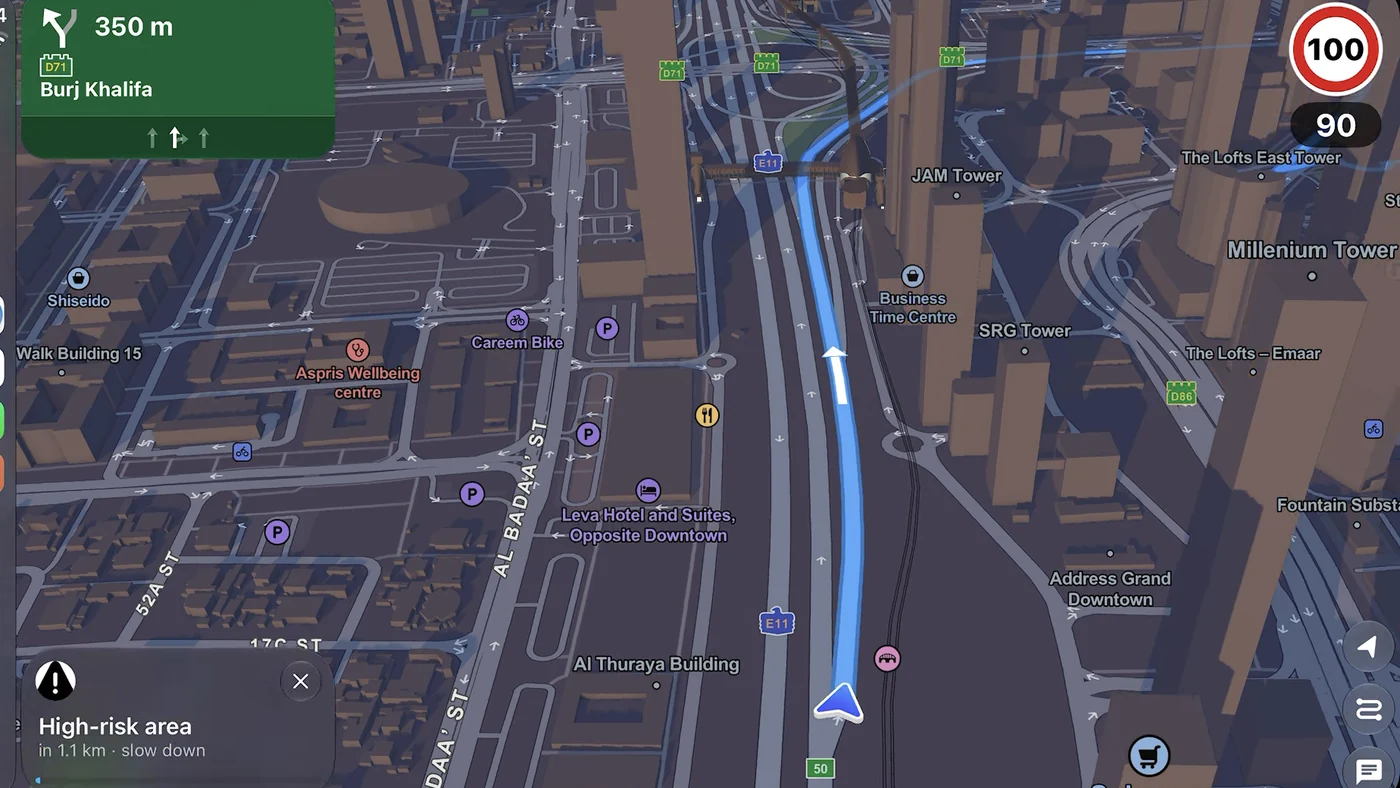
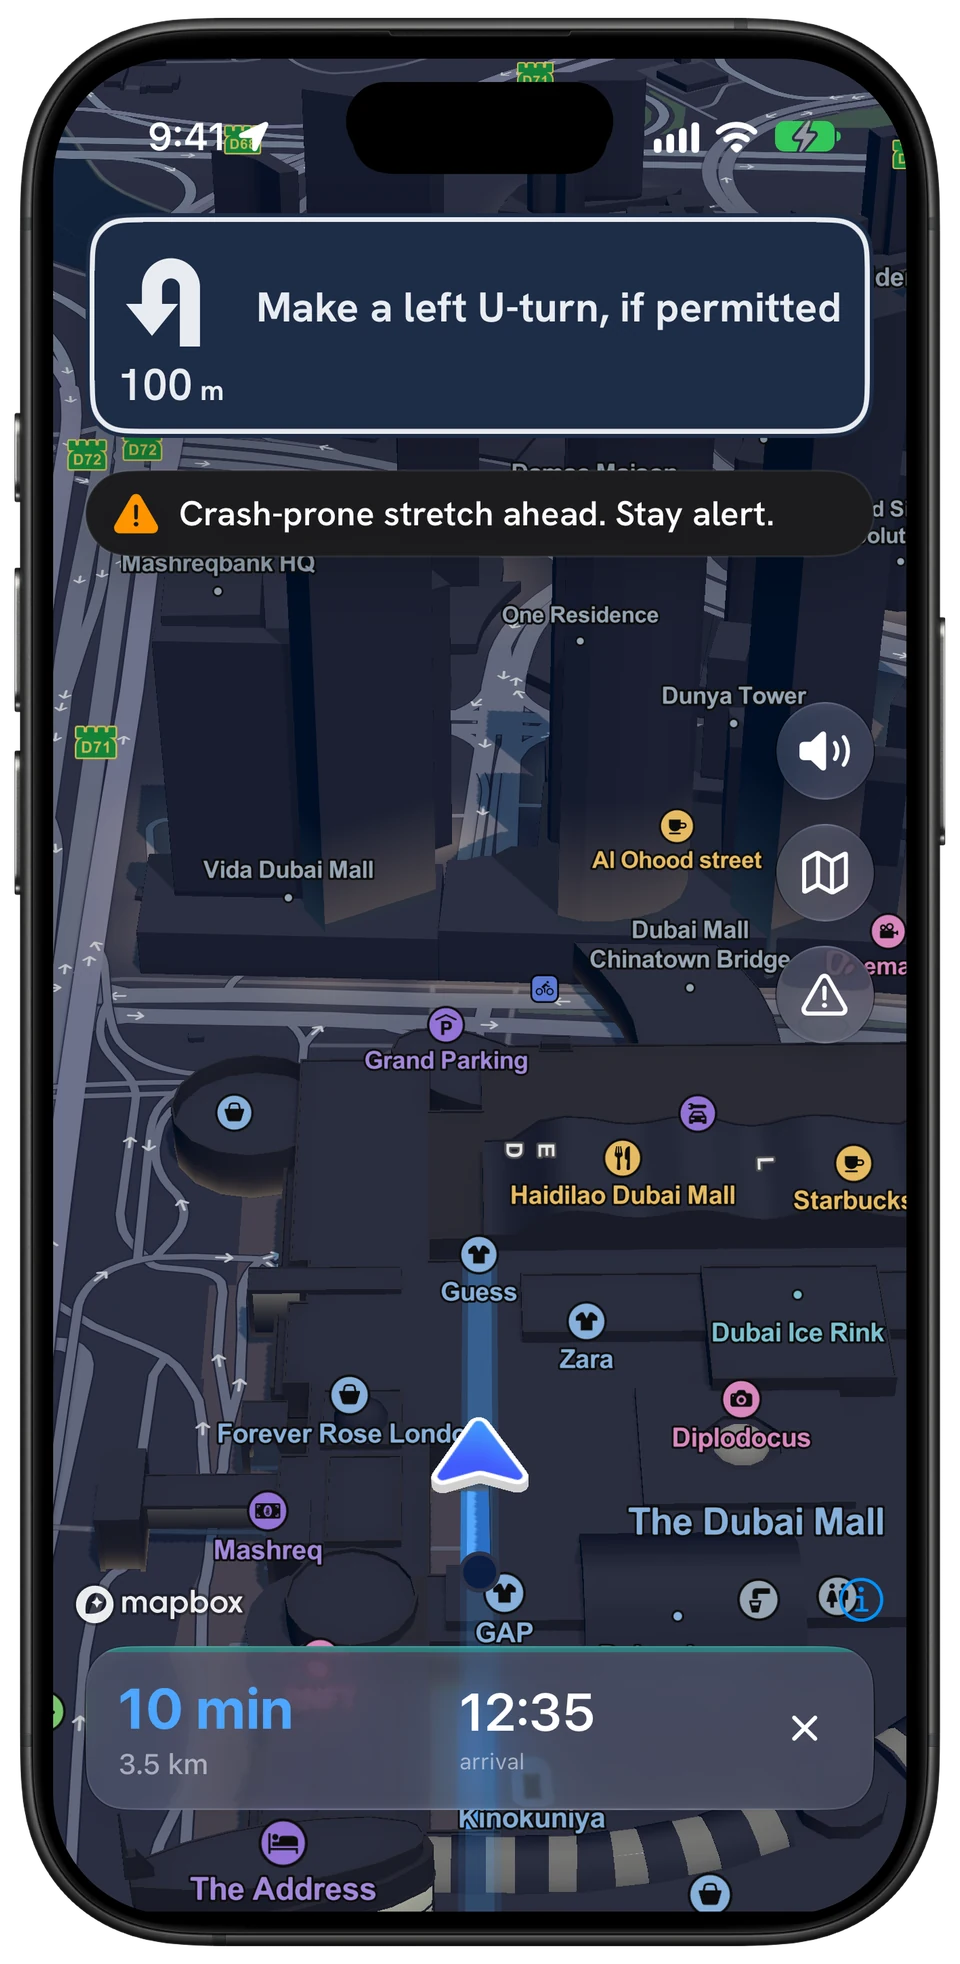
We back-test every zone on years the model never saw. What survives ships to the car: a warning about a kilometre before the stretch.
297accident-prone zones, back-tested
03 · The whole country
From Dubai to Abu Dhabi.
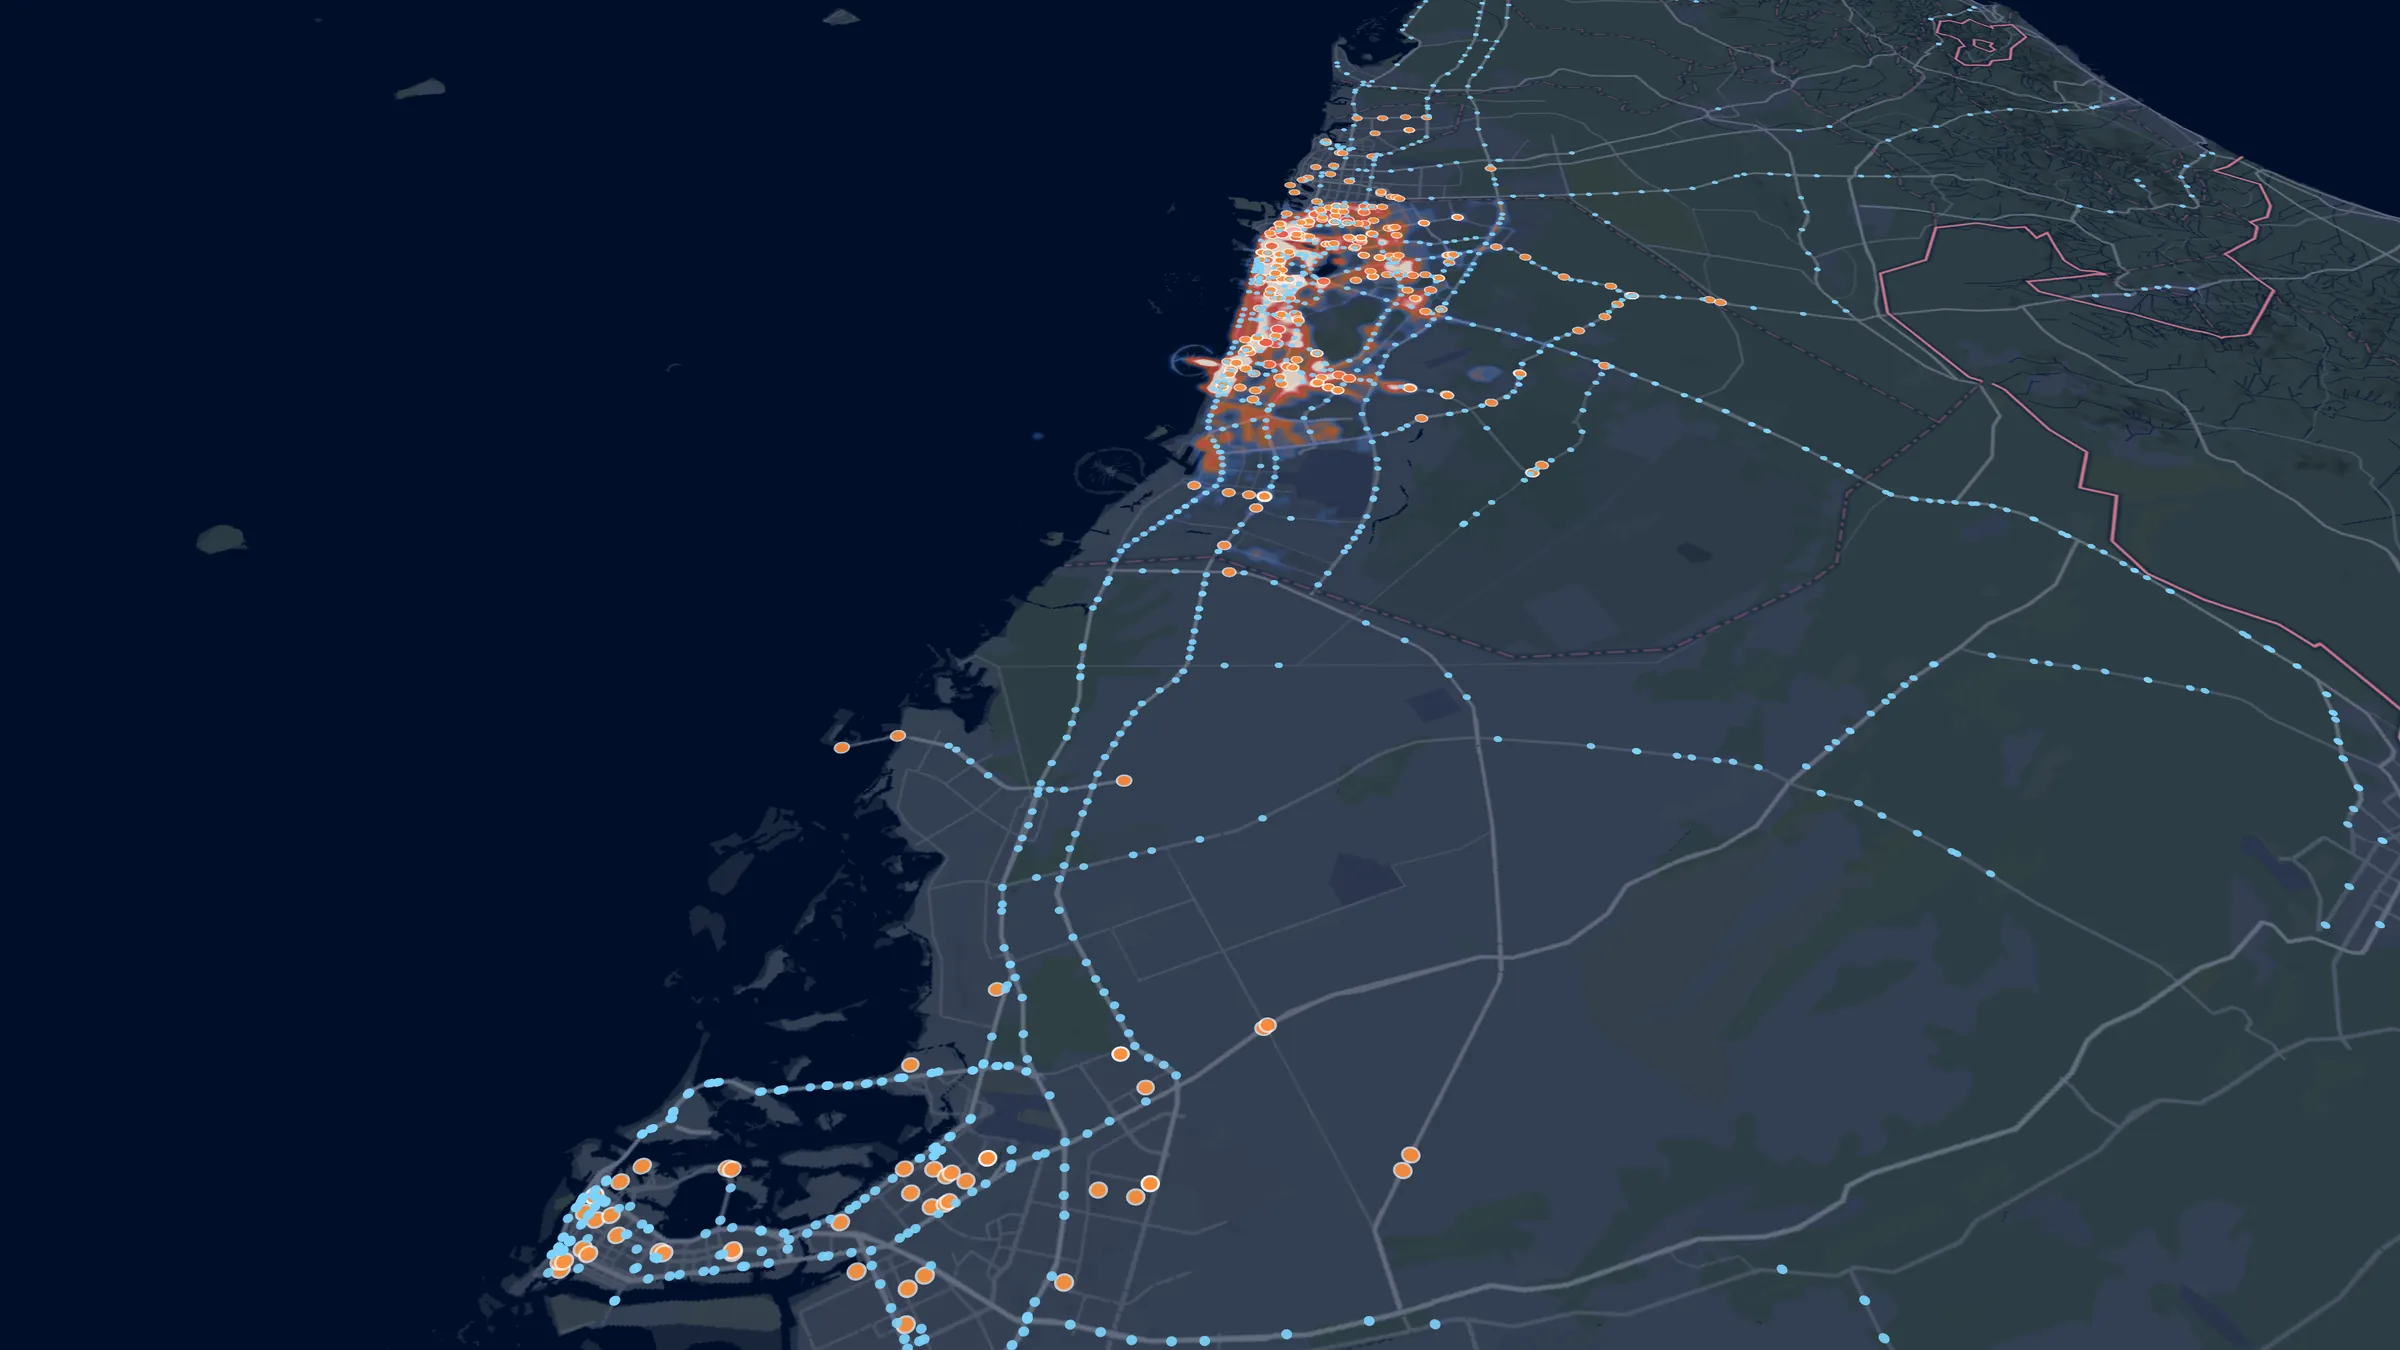
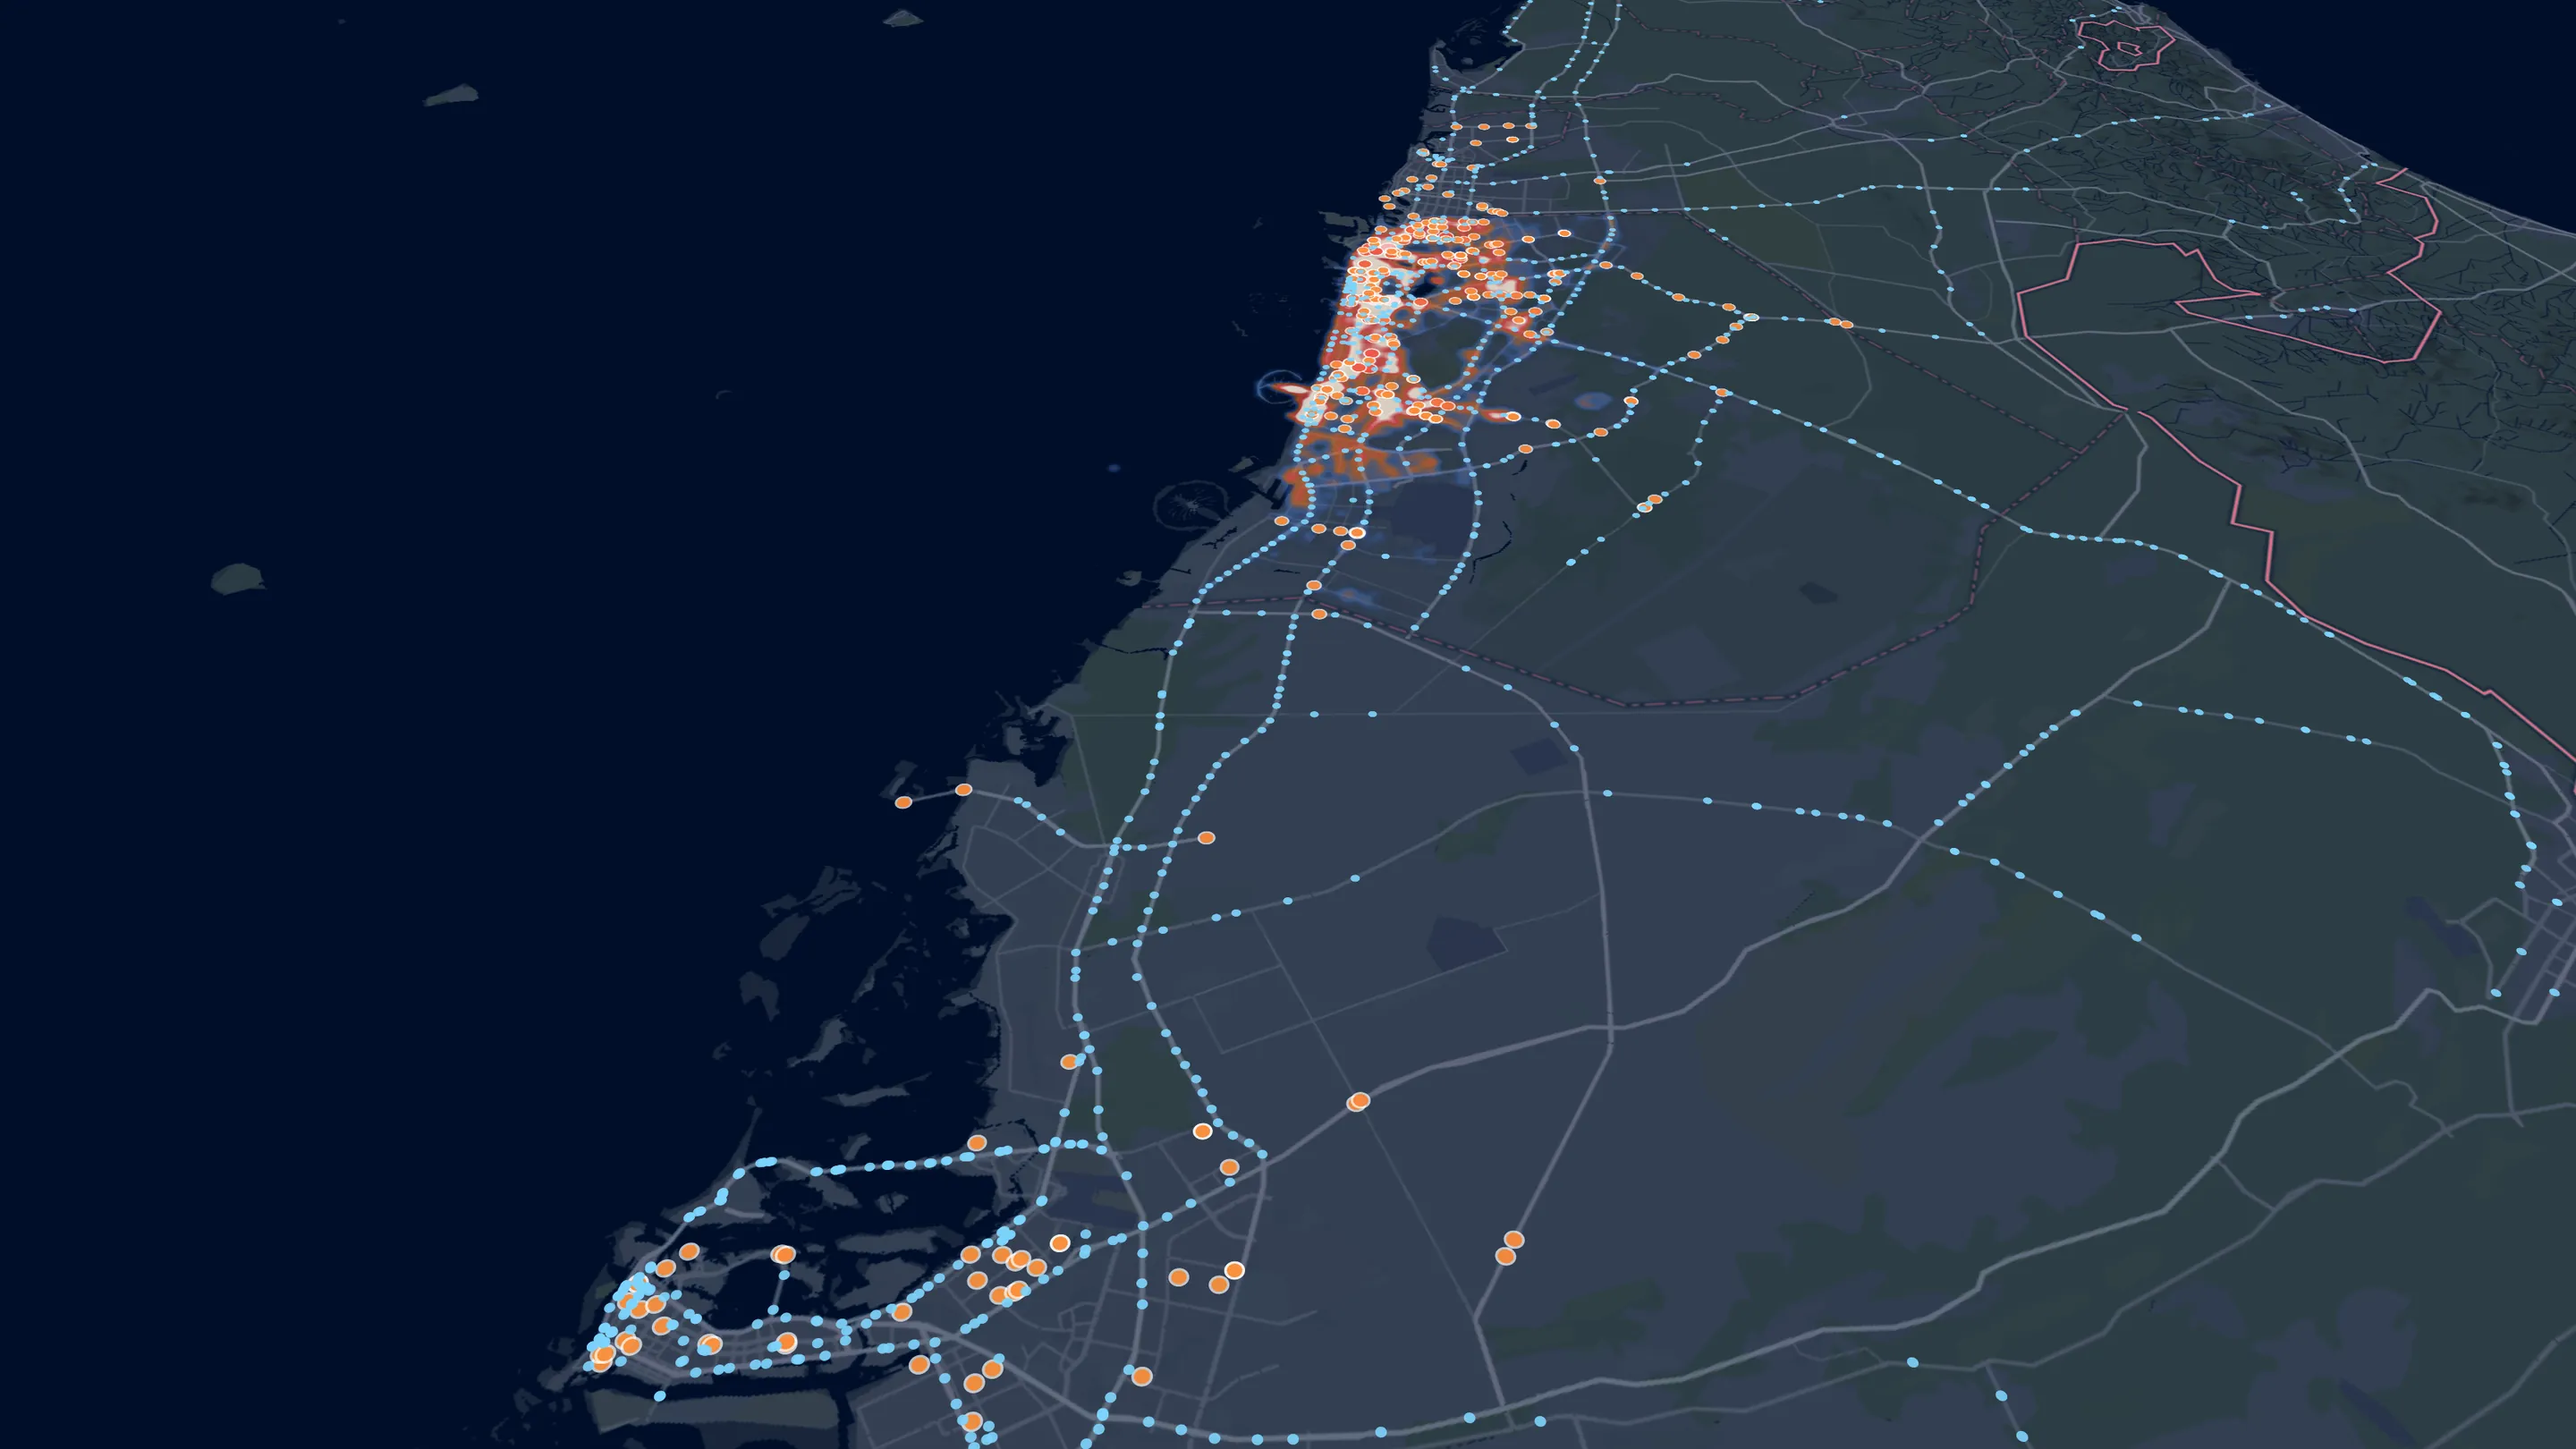
Zones across three emirates and every mapped speed camera on the network, delivered lane by lane on the phone and on CarPlay.
1,247speed cameras mapped
04 · Next
Then MENAP.
Live in the UAE and Pakistan. The same platform extends across the GCC, the Levant and North Africa.
2markets live today
The data behind the warnings
751,323police reports analysed.
Dubai, 2018 to 2026. Cleaned and placed on the road each one happened on.
- accident-prone zonesBack-tested, rolling out in the app
- 297
- speed cameras mappedAcross the UAE
- 1,247
- enforcement zonesLahore and Karachi
- 3,215
- places mappedUAE and Pakistan
- 376,109
What the data says
Risk has a place and a time.
3.7×
more crash reports a year near the roads we flag than near a random road.
2.4×
better at finding real hot spots than rule-based zones, with 50× fewer alerts.
22.2%
of night crashes are serious, against 16.5% by day.
Wednesday 15:00Busiest hour · 1,679 crash reports
Crash reports by weekday and hour, last 3 years
Table view
| Day | 0 | 1 | 2 | 3 | 4 | 5 | 6 | 7 | 8 | 9 | 10 | 11 | 12 | 13 | 14 | 15 | 16 | 17 | 18 | 19 | 20 | 21 | 22 | 23 |
|---|---|---|---|---|---|---|---|---|---|---|---|---|---|---|---|---|---|---|---|---|---|---|---|---|
| Mon | 588 | 401 | 301 | 285 | 245 | 284 | 354 | 651 | 1019 | 1101 | 1226 | 1364 | 1499 | 1569 | 1617 | 1611 | 1567 | 1425 | 1475 | 1346 | 1172 | 1075 | 939 | 630 |
| Tue | 549 | 433 | 370 | 265 | 321 | 295 | 445 | 653 | 962 | 1136 | 1219 | 1331 | 1448 | 1567 | 1588 | 1547 | 1573 | 1535 | 1401 | 1280 | 1230 | 1068 | 898 | 635 |
| Wed | 529 | 387 | 344 | 276 | 297 | 301 | 383 | 635 | 989 | 1199 | 1194 | 1405 | 1463 | 1532 | 1541 | 1679 | 1576 | 1485 | 1409 | 1262 | 1269 | 1137 | 931 | 643 |
| Thu | 597 | 442 | 396 | 328 | 331 | 324 | 450 | 683 | 970 | 1086 | 1229 | 1351 | 1434 | 1502 | 1514 | 1489 | 1555 | 1513 | 1425 | 1248 | 1292 | 1130 | 963 | 663 |
| Fri | 630 | 527 | 393 | 332 | 335 | 353 | 399 | 595 | 842 | 1096 | 1153 | 1291 | 1391 | 1363 | 1534 | 1443 | 1472 | 1402 | 1292 | 1308 | 1188 | 1151 | 1037 | 733 |
| Sat | 793 | 633 | 523 | 446 | 461 | 409 | 360 | 512 | 627 | 828 | 1014 | 1200 | 1347 | 1476 | 1504 | 1447 | 1528 | 1357 | 1374 | 1262 | 1261 | 1228 | 1092 | 785 |
| Sun | 902 | 703 | 571 | 481 | 538 | 446 | 388 | 394 | 488 | 605 | 823 | 904 | 1031 | 1165 | 1215 | 1218 | 1160 | 1214 | 1162 | 1120 | 1065 | 1031 | 948 | 635 |

Community layer · rolling out
Drivers report the road. Drivers confirm it.
On top of the police data, drivers add what is happening now. Every pin is merged, voted on and expires on its own, so the map stays live.
01
Report
A driver flags a crash, hazard, closure, camera or wrong limit in a tap.
02
Merge
Reports of the same kind within 120 m become one pin.
03
Confirm
Drivers nearby confirm or deny. Confirmed pins stay; denied ones drop.
04
Expire
Each pin lives as long as its kind: an hour for traffic, a month for a camera.
8 report types · rolling out in the app.
FAQ
Road risk in the UAE, answered.
Which roads in Dubai have the most crash hot spots?
In the last three years of Dubai Police crash reports, the roads with the most 150-metre crash clusters are Sheikh Mohammed Bin Zayed Road, Sheikh Zayed Road, Al Khail Road, Al Wasl Road, Jumeira Street and Hessa Street. Busy roads naturally see more reports, so Guardian AI compares each stretch with roads of the same class before it warns about it.
When do most crashes happen in Dubai?
On weekday afternoons. Over the last three years the busiest hour in Dubai Police crash reports is Wednesday at 15:00, and the quietest hours are before dawn. Night crashes are more often serious: 22.2% of crash reports between 22:00 and 04:00 are labelled serious, against 16.5% by day.
How many road accidents are reported in Dubai each year?
Dubai Police received 59,053 crash reports in 2025, about 162 a day. Guardian AI has analysed 751,323 Dubai Police incident reports from August 2018 to October 2026, of which 432,761 are crashes.
Do accident hot spots in Dubai stay in the same places?
Yes. Crash density on held-out reports from 2025 and 2026 matches the 2018 to 2024 pattern almost exactly (a rank correlation of 0.96), which is why warnings based on past reports work for the roads drivers use today.
What is the main cause of injury accidents in Abu Dhabi?
Distraction. It caused 34.4% of injury accidents in Abu Dhabi from 2022 to 2025, ahead of failing to give way (11.4%) and running a red light (10.7%), according to Abu Dhabi Police open data. 2,656 people were injured on Abu Dhabi roads in 2025.
How many speed cameras are there in the UAE?
Guardian AI maps 1,247 fixed speed and red-light cameras across the UAE from OpenStreetMap: 558 in Abu Dhabi, 448 in Dubai and about 241 in the northern emirates and Hatta. It is a community-mapped layer, not an official list.
How does Guardian AI warn drivers about accident-prone areas?
During navigation, on the phone and on CarPlay, Guardian AI warns about a kilometre before an accident-prone stretch. Its 297 zones (220 in Dubai, 53 in Abu Dhabi and about 24 in Sharjah) are back-tested: they see 19.8 held-out crash reports a year within 150 metres, against 5.4 on a random road. The new zones are rolling out in the app.
Where does the road-risk data come from?
Dubai Police traffic incidents (Dubai Pulse open data), Abu Dhabi Police traffic-accident reports (Abu Dhabi Government Open Data Licence) and OpenStreetMap contributors (ODbL), processed by Guardian AI. The figures describe reported incidents, not a statement that a place is dangerous.

Free on iPhone and Android
Get the warning before the stretch.
Guardian AI warns you about accident-prone stretches during navigation, on your phone and on CarPlay. Free.
Based on Dubai open data: Dubai Police traffic incidents (dp_traffic_incidents-open), published on Dubai Pulse / Data.Dubai under the Dubai Open Data Licence; the aggregates on this page are shared under the same licence. Also OpenStreetMap contributors (ODbL) and Guardian AI analysis. Maps © Mapbox © OpenStreetMap. Figures describe reported incidents, not a statement that a place is dangerous.
Not affiliated with or endorsed by the Government of Dubai.